Monitoring Elixir apps in 2016: Prometheus and Grafana
This post stands in as a tutorial for prometheus.ex.
The gold standard in Elixir app monitoring has long been Exometer with StatsD, which, let me tell you right now, is an awful nightmare to set up. A bunch of crusty forks and hacks depending on super-specific versions of one another – I tried, failed, and gave up.
Fortuitously, Ilya Khaprov just a few days ago published a bunch of Elixir packages that will help you use Prometheus instead, and I love it enough to help you set it up.
Prometheus Overview
In 2016, app monitoring is a three-step process:
- Your app/microservice keeps track of data (“metrics”) about itself
- Periodically, that data is saved to disk (i.e. what Prometheus does);
- A web-based graphing app grabs data from the store and plots it. You’ll be building your own and integrating it into the admin backend of your product … hah, who are we kidding, you have better things to do with your life.
Run Prometheus, and it will ask your app for the latest stats every, say, 15 seconds. This happens via a GET request to /metrics, a URL which your app is expected to expose (this seemed overly complicated to me at first, but it actually makes things surprisingly hassle-free).
In the meantime though, between those requests, your app is responsible for tracking its own data points. This is precisely what Ilya’s prometheus.ex will do for you.
If needed, read the last three paragraphs again to make sure everything makes sense
Prometheus.ex setup
Just follow along, I’ll explain later.
Here are the basic Mix dependencies you’ll want to grab for your Phoenix/Ecto based project:
{:prometheus_ex, "~> 1.0"},
{:prometheus_ecto, "~> 1.0"},
{:prometheus_phoenix, "~> 1.0"},
{:prometheus_plugs, "~> 1.0"},
{:prometheus_process_collector, "~> 1.0"},
Make sure to add them to the :applications list as well, so they get packaged into releases:
:prometheus_ex, :prometheus_ecto, :prometheus_phoenix, :prometheus_plugs, :prometheus_process_collector
Next, some configuration:
config :prometheus, App.PhoenixInstrumenter,
  controller_call_labels: [:controller, :action],
  duration_buckets: [10, 25, 50, 100, 250, 500, 1000, 2500, 5000,
                     10_000, 25_000, 50_000, 100_000, 250_000, 500_000,
                     1_000_000, 2_500_000, 5_000_000, 10_000_000],
  registry: :default,
  duration_unit: :microseconds

config :prometheus, App.PipelineInstrumenter,
  labels: [:status_class, :method, :host, :scheme, :request_path],
  duration_buckets: [10, 100, 1_000, 10_000, 100_000,
                     300_000, 500_000, 750_000, 1_000_000,
                     1_500_000, 2_000_000, 3_000_000],
  registry: :default,
  duration_unit: :microseconds

# as well as ...
config :app, App.Repo,
  adapter: Ecto.Adapters.Postgres,
  ...
  loggers: [App.RepoInstrumenter] # and maybe Ecto.LogEntry? Up to you
The three modules you see there – App.PhoenixInstrumenter, App.PipelineInstrumenter, and App.RepoInstrumenter – those are files you have to create yourself. But fear not. All they do is pull in the code from Ilya’s packages you’ve already downloaded. Here they are:
defmodule App.PhoenixInstrumenter do
  use Prometheus.PhoenixInstrumenter
end
defmodule App.PipelineInstrumenter do
  use Prometheus.PlugPipelineInstrumenter

  def label_value(:request_path, conn) do
    conn.request_path
  end
end
defmodule App.RepoInstrumenter do
  use Prometheus.EctoInstrumenter
end

If your app isn’t called `App`, or you’d like to file them under, say, `App.Endpoint.…` instead, that’s up to you. I’m keeping these files under `lib/app`, but that, too, is a matter of preference.

Finally, we want our metrics made available in Prometheus-specific format under `/metrics`. What do you know, all you need to do is pull in the respective code by creating (again, module name is up to you):

```elixir
defmodule App.PrometheusExporter do
  use Prometheus.PlugExporter
end
Almost done. You’ll also want to add
plug App.PrometheusExporter     # makes the /metrics URL happen
plug App.PipelineInstrumenter   # measures pipeline exec times
to your endpoint.ex (I put mine just before my plug App.Router, but it really shouldn’t matter).
Starting the instrumentation with your app
Go into your app.ex file – or whatever it’s called, the one where your app is started, you know which one I mean, and add:
App.PhoenixInstrumenter.setup()
App.PipelineInstrumenter.setup()
App.RepoInstrumenter.setup()
Prometheus.Registry.register_collector(:prometheus_process_collector)
App.PrometheusExporter.setup()
preferably before Supervisor.start_link is called.
Notice how the line for :prometheus_process_collector is different? That’s because it is only available as an Erlang package. Easy peasy, the register_collector function will make sure that it’s up and collecting values even in interactive-mode Elixir (i.e. when you’re running mix/iex during development, when modules aren’t automatically loaded).
Setting up Prometheus and Grafana
Up next: download Prometheus. It’s a single precompiled binary with a single configuration file, which feels almost too good to be true in 2016. By default, it requests (“scrapes”) its own stats. See how in prometheus.yml it says targets: ['localhost:9090']? The 9090 is its own default port. Change that instead to wherever your app is listening, then run Prometheus.
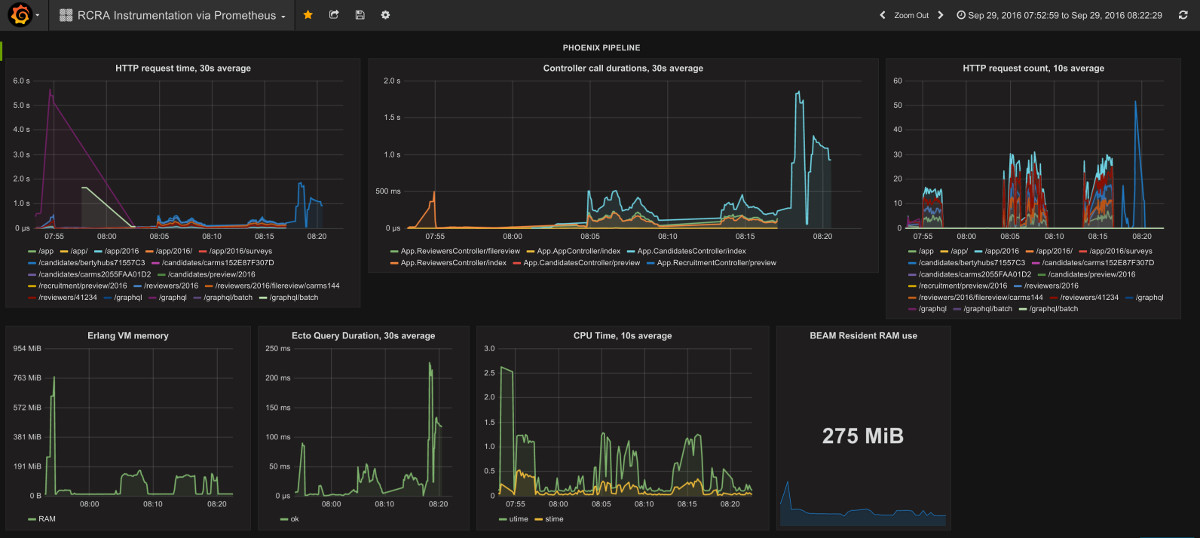
And finally, for graphing, download Grafana by whatever means (but get the latest version). Just like Prometheus, Grafana is a binary written in Go with a single config file at /etc/grafana/grafana.ini. Unlike Prometheus, it runs in the background – on Debianoids, use sudo service grafana-server start. Open its web interface (port 3000 by default), add Prometheus as a datasource and start creating graphs. To get started, I recommend you import this rudimentary JSON config belonging to the dashboard shown at the top of this post, then edit the graphs’ metrics/queries to get a feel for Grafana’s UI.
Metrics
So, what are those Mix packages you set up earlier, and what do they offer?
prometheus_phoenix measures how long it takes to execute a request to a Phoenix route, and outputs the metric phoenix_controller_call_duration_microseconds in three variants: sum, count, and buckets. The Histograms and Summaries page of Prometheus’ docs perfectly explains how to use those.
prometheus_ecto similarly taps into Ectos logs to provide sum, count and buckets for ecto_query_duration_microseconds. If you need the exact breakdown, it also offers ecto_queue_duration_microseconds, ecto_db_query_duration_microseconds and ecto_decode_duration_microseconds.
prometheus_plugs is a two-in-one package. It contains both the Prometheus.PlugExporter which you need purely to get the /metrics route to work, as well as the pipeline instrumenter, which measures both http_requests_total and http_request_duration_microseconds of the whole plug pipeline (or of specific plugs, if you wrap them accordingly – look at the docs).
Oh, by the way – all my metrics end in _microseconds, but metrics are macros; you can edit the config files above to specify a different base time unit instead.
prometheus_process_collector measures things like your app’s RAM or CPU usage (as process_resident_memory_bytes and process_cpu_seconds_total), among others. It’s written in Erlang, not Elixir, and it calls a C binary to read data directly from /proc entries. NIFs creep me out, but for the basics it’s easier to use this than to deal with yet another external binary like node_exporter.
prometheus_ex: well, all that collected data has to be put somewhere, right? This package is a wrapper around prometheus.erl, which manages the above collectors and keeps track of their measurements.
That’s it. I do recommend that you skim over the docs of all of the packages and especially over those of Prometheus and Grafana. They really are quite helpful.
Thank you
Credit for those new Elixir packages goes to Ilya Khaprov alone – I’m quite sure the Elixir community will cherish them for years to come.